Unlocking Your Full Potential: Insights from a Metabolic Assessment

Physiological testing is a powerful tool to fine-tune your training and optimize performance.
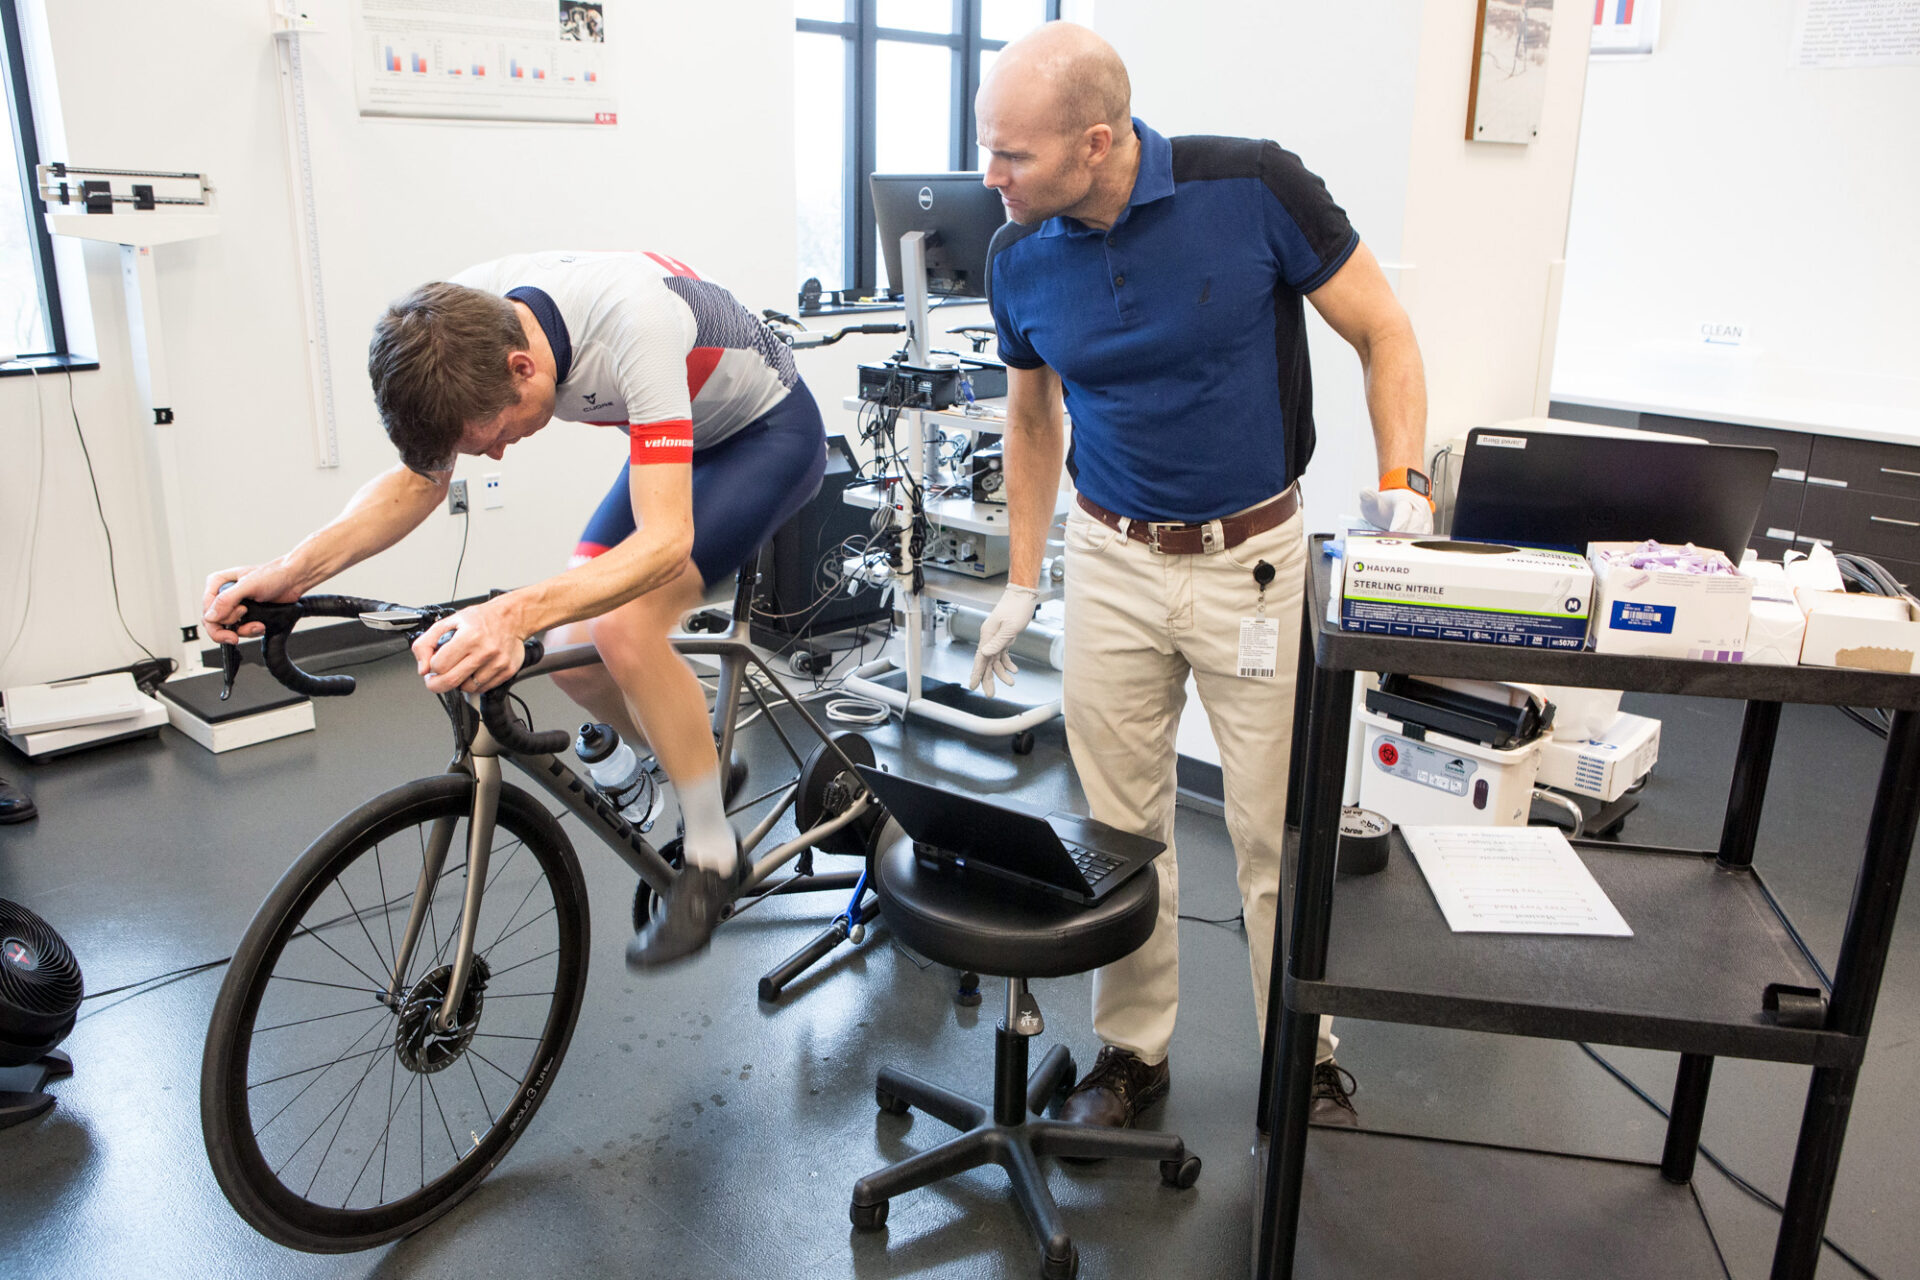
Chris Case CU physiology lab test Jared Berg Fast Talk Laboratories

Understanding how your body responds to different exercise intensities is crucial for optimizing performance and achieving fitness goals. A full metabolic assessment provides valuable insights into your body’s unique responses, helping you tailor your training for maximum efficiency.

I’ve conducted hundreds of these assessments, and have worked with countless athletes to use the information gathered from this type of testing to help them reach new heights. (The metabolic assessment is just one of the Athlete Services we offer at Fast Talk Labs.)

Here’s what you can learn from this comprehensive evaluation.

Lactate Accumulation at Various Intensities

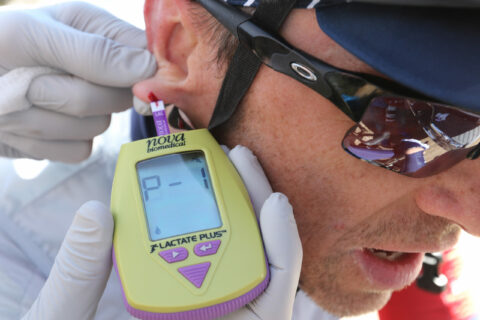
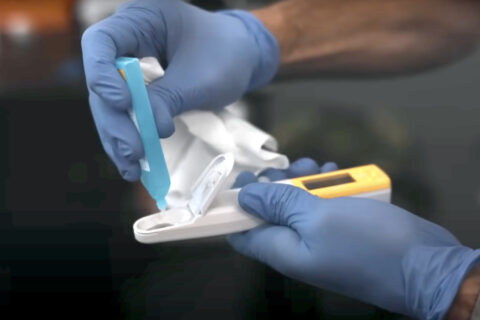
How your body accumulates lactate at different exercise intensities, while running or cycling, is one of the key metrics measured during a full metabolic assessment. Lactate is a byproduct of anaerobic metabolism, and its accumulation in the blood can indicate the intensity at which your body transitions from aerobic to anaerobic energy production.

Understanding this can help you manage your training intensity to avoid premature fatigue. For example, an elite marathon runner might find that their lactate levels rise significantly at a 5:30-per-mile pace, indicating the transition from primarily aerobic to more anaerobic metabolism. This information helps an athlete manage their race pace to avoid experiencing too much fatigue too early in an event.

Individualized Training Zones

The information you gain from a metabolic assessment allows you and/or your coach to individualize your training zones, based on the physiological thresholds determined during the test session. Your training can then be aligned with your fitness levels, accurately anchored to your specific thresholds. Using threshold-optimized training zones will help you ensure you are training at the right intensity to optimize adaptation and performance, and avoid overtraining.

Using a metabolic cart and lactate meter, I can examine two specific physiological markers; then I can create five training zones. These physiological inflection points include lactate and ventilatory threshold 1 (LT1/VT1) and lactate and ventilatory threshold 2 (LT2/VT2). I can also use VO2max to help me more precisely define the upper range of zone 5 and provide a starting point for the anaerobic zone 6.

Using LT1 and VT1 to define Zone 2

Zone 2 is often defined based on lactate threshold 1 (LT1) and ventilatory threshold 1 (VT1). This zone often correlates with higher fat metabolism. To identify it, we first look at test data to spot the first rise in lactate levels above baseline (which typically defines LT1). We surmise that an athlete reaches VT1 when ventilation increases faster than oxygen consumption increases.  

Training in zone 2 is crucial for building aerobic capacity and improving endurance. Zone 2 is an intensity at which your body efficiently burns fat for fuel, making it an essential part of any endurance training program. For more on the power of zone 2, listen to episode 334 of Fast Talk

In the graph below, you can see how the cyclist’s lactate levels rise above baseline, and fat utilization begins to fall significantly, around 220 watts and a heart rate of 140 bpm. Training at this intensity will help this athlete build endurance and improve their ability to burn fat for fuel, which is crucial for long rides and races.

The colored bars above the graph help with the explanation of results. The blue bar indicates when Type I (slow twitch) muscle fibers are active (always). The green bar indicates when Type IIa muscle fibers become more involved (when lactate moves off baseline and fat utilization starts to fall). The red bar indicates when Type II b/x muscle fibers become more involved (when lactate is around threshold and fat utilization is at or near zero).

Metabolic test results, sample graph

Are you wondering where zone 1 is? I typically place the ceiling of zone 1 around 10% below LT1/VT1, but it can vary based on how the body responds to increasing workloads. In some athletes, the so-called fat max zone is noticeably lower than the point when lactate begins to rise from baseline; thus, I will assign that to the top of the athlete’s zone 1.

Wait, what about zone 3? Dialing in the whereabouts of zone 3 is best done by doing something called a steady state lactate assessment. The top of zone 3 is Maximum Lactate Steady State (MLSS). MLSS represents the highest sustainable intensity where lactate will not rise much more than a concentration of 0.2-0.5 mmol.

Unfortunately, this is a rather time-consuming test, so I typically define the top of zone 3 at around 95% of LT2 or VT2. I will also look at specific lactates and respiratory data points for clues as to where lactate will stay steady.

Using LT2 and VT2 to define Zone 4

Lactate threshold 2 (LT2) and ventilatory threshold 2 (VT2) are critical markers used to dial in high-intensity training. LT2 represents the point at which lactate accumulates rapidly in the blood, while VT2 indicates the exercise intensity at which breathing becomes disproportionately heavy and CO2 starts to build up in the blood. A second inflection point and steeper upward-sloping lactate curve helps define LT2.

Typically, fat utilization drops to near zero at this point, unless the athlete is restricting carbohydrates. Training at or near these thresholds can significantly enhance aerobic and anaerobic capacity and, therefore, overall performance. Within many training zone systems, LT2 and VT2 fall in the upper 75% of zone 4.

Carbohydrate Utilization

Knowing how many carbohydrates you burn at race and training paces is vital for fueling your body correctly. The metabolic assessment provides detailed information on carbohydrate utilization, helping you plan your nutrition strategy to ensure you have sufficient energy for training and competition.

For example, an Ironman triathlete might learn that they burn 100 grams of carbohydrates per hour at their race pace. After estimating how many carbohydrates the athlete stores in their muscle, we can use this data to calculate the amount of carbohydrates the athlete needs to consume during their event.

Fat Utilization

Exploring how your body uses fat at different exercise intensities can help you optimize fat utilization to enhance endurance training. The assessment reveals the intensity at which your body transitions from burning fat to relying more on carbohydrates, allowing you to adjust your workouts to maximize fat burning.

Discover Areas of Need

Finally, a full metabolic assessment helps you determine other physiological attributes that may need to be addressed. By understanding your unique metabolic profile, you can tailor your training to target specific areas of improvement, whether that be increasing endurance, building threshold capacity, or enhancing top-end speed. Then, you (and/or your coach) can decide on the best training practices to improve those fitness characteristics.