 Basic Performance Data Analysis Pathway
Experts in this Pathway
What You’ll Learn
Understand Your Performance.
Endurance training can sometimes feel like a numbers game. How can athletes determine which numbers matter most? In this Pathway, our coaches and physiologists simplify the abundance of training data gathered by power meters, recovery straps, wearable devices, GPS units, smartwatches, and more into your Key Performance Indicators. Follow this Pathway for a new approach that maximizes signal and minimizes noise.
Of course, collecting those numbers is only the first step. Data analysis, monitoring, and management are all critical aspects of training and, therefore, improving fitness. Whether you use several devices to collect an assortment of numbers—highlighting relationships between the data and our physiology and performance—or you stick with just the tried-and-true heart rate strap, knowing how to best analyze and interpret data is as much art as it is science. Just as important is understanding the value of our “internal” power meter—sensations and perceived effort—and how to interpret that signal.
This pathway contains content from many of our experts, including Neal Henderson, Tim Cusick, Trevor Connor, Dr. Stephen Seiler, and Ryan Kohler, to name a few. Follow this Pathway to start with the basics of data and progress to more detailed ways of analyzing metrics to improve how you manage and monitor your training and performances.
Data analytics 101
Coaches Ryan Kohler and Trevor Connor set the stage by giving an overview of the three most popular data analysis tools—TrainingPeaks, Strava, and Garmin Connect—to highlight each program’s strengths and weaknesses. Click below to watch this workshop.

The Best Features of TrainingPeaks, Strava, and Garmin Connect
What to do, and not do, with data
With well over 20 years of experience and education, elite coach Neal Henderson offers a short list of dos and don’ts to inform your data analysis. Neal also highlights one of the first steps for any athlete beginning a training journey: determining your strengths and weaknesses to inform your individual training needs. Read this article below.
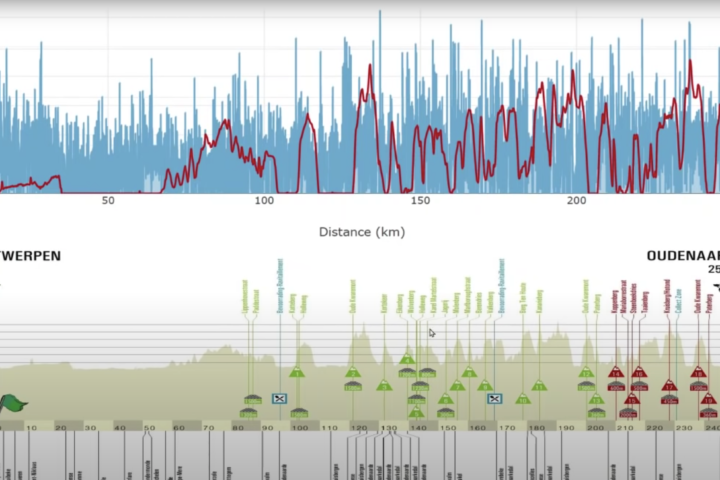
What Training Data Tells Us, and When to Ignore It
The data… and beyond
In this podcast, we hear from a master of data analytics, Tim Cusick, who not only leads the development of TrainingPeaks’ WKO platform, but who is also an elite cycling coach of athletes including Amber Neben and Rebecca Rusch.
While you might think that this episode is beyond the basics, listen to learn more about one of the key messages: Data is not the solution unto itself. We discuss everything from the basic terminology associated with data analysis, to the “content” of your training sessions, to how this information can be used to better inform your decision-making process.
You will hear from additional experts and pro athletes including physiologist Jared Berg, pro mountain biker Payson McElveen, the legendary Ned Overend, WorldTour veteran Brent Bookwalter, and Xert creator Armando Mastracci. Click below to listen to this podcast.

How to Use Data to Make Better Training Decisions, with Tim Cusick
Knowing your numbers
Every athlete can benefit from being reminded that it’s not all about the numbers and data. In this podcast, hear from ex-professional cyclist, amateur comedian, and ordained minister Phil Gaimon, who highlights the importance of developing that “feel” within the body.
The conversation then leads to a discussion about why you shouldn’t jump into over-analyzing, and why you should align your sensations with the data you’re seeing.
In the end, it’s still a numbers game. Dirk Friel, ex-professional cyclist and co-founder of TrainingPeaks, reviews some of the basics of data to help you venture into the world of performance analytics. Click below to listen to this podcast.

Training As a Numbers Game
“Social” training tools
Strava, Garmin Connect, intervals.icu, Zwift. These are some of the many training tools that align training analysis and metrics with social media. The result? A platform that moves your assessment of training sessions out of your own line of sight and puts it in the social media spotlight, complete with comments, kudos, and thumbs-ups to provide a level of community involvement and support never available before.
The big question is: “Do these tools actually help, or hurt, our training?” The answer, it seems, is that it depends on how you use them. Trevor Connor explains how to utilize these training tools smartly, how to avoid some of the common pitfalls, and, ultimately, how to periodize your training appropriately. Coach Grant Holicky summarizes a study that looked at reasons we use social platforms, like Zwift, and discusses how we can use this “gamification” of training to our benefit. Read this article below.

An Exploration of “Social Training Tools”
How to Monitor Training Data
The “holy trinity” of training
Now that you understand some of the basics of training tools and how to use them, this workshop will help you apply these concepts to your own preparation and training.
World-renowned physiologist Dr. Stephen Seiler discusses the “holy trinity” of monitoring your training. Why do we monitor training? How do we go about monitoring and, importantly, how do we use this “holy trinity” approach to integrate the necessary data to allow us to make the best decisions?
Learn one of the common pain points for athletes: how to identify acute fatigue, and how to interpret this fatigue to inform your training decisions. Dr. Seiler presented this seminar at the ITU World Triathlon Edmonton 2020 Science and Triathlon Virtual Conference: Planning for 2021 and Beyond, and we share it here with his permission. Click below for this workshop.
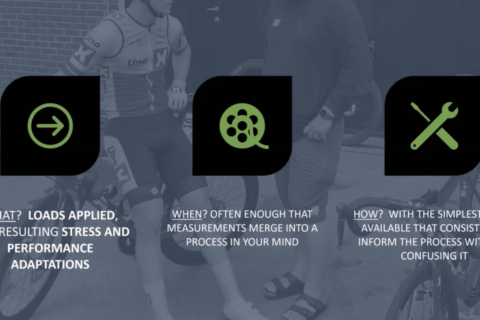
The Holy Trinity: How to Monitor Training
All about LSD
In this workshop, Coaches Trevor Connor and Ryan Kohler use TrainingPeaks to analyze several long, slow distance (LSD) ride files. While it might seem to be a simple task, many people struggle to grasp exactly what this entails. Click below for this workshop.
How Steady Should Your Long Slow Distance (LSD) Rides Be?
Data at your fingertips
It seems basic, but data collection and management start with your bike computer or head unit. There is more data available than you can possibly use at any given time, so how do you take in all of the available information?
In this webinar, Coach Ryan and Coach Trevor demonstrate how they set up their bike computers. You can also refer to the follow-up forum post where Trevor lists many of his Garmin IQ Apps and screens so you can optimize your own screen real estate by borrowing from a real data expert. Click below for this webinar.
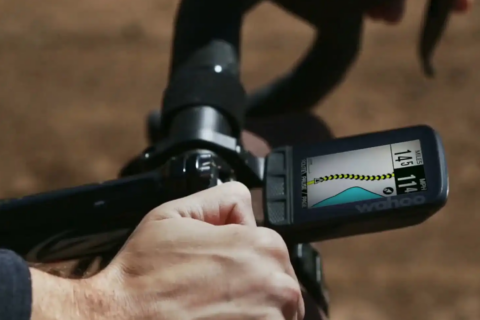
How to Set Up Your Bike Computer
The 20-minute FTP test
Next, let’s review one of the fundamental data analysis sessions you will encounter—determining your FTP from a 20-minute test. Coach Trevor and Coach Ryan analyze data from three of Trevor’s 20-minute power tests. One test went according to plan, while the others were a bit disappointing.
Together, they offer important lessons on how to determine your FTP based on this test protocol, and on the proper execution of these intervals. Ride data will reflect external factors like life stress or poor sleep. Learning how that comes across in the graphs can be confusing. Click below for this workshop.
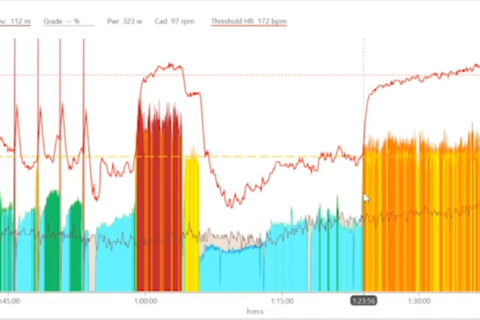
Coach’s Corner: How to Determine FTP from a 20-Minute Power Test
The classic 5×5 interval
An analysis of the classic 5×5 interval offers more opportunities to explore the capabilities of TrainingPeaks. Coach Trevor and Coach Ryan walk through their process for interpreting 5×5-minute interval workout sessions. They also explain the importance of rest periods between intervals and give tips on what your heart rate should be at various points during the workout. Click below for this workshop.
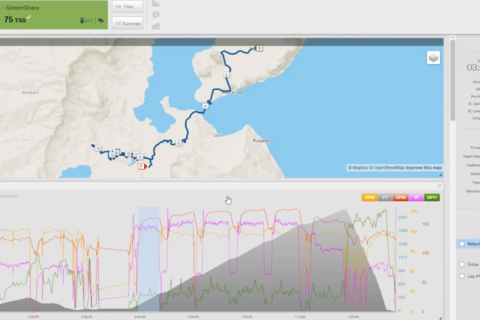
How to Analyze 5×5 Intervals in TrainingPeaks
Tracking the heart rate/power relationship
Now we shift our focus to long-term data analysis. In this workshop, learn how to track the heart rate and power relationship over time to inform your training. Utilizing intervals.icu online software, Coach Ryan reviews season-to-season changes in heart rate/power distributions, highlighting the ease with which you can determine if your training is hitting the appropriate energy systems by looking at training distribution. Click below for this workshop.
How to Track the Long-Term Relationship Between Heart Rate and Power
Bolstering your FTP data
Now that you know how to analyze 20-minute power tests, you might be wondering how you can pull useful information from longer efforts. The ride may not have been intended as a “test,” but it can still provide actionable information that can inform your progress.
Coach Trevor and Coach Ryan show you how to analyze data from longer threshold efforts—in the 60- to 90-minute range—to support results you may have garnered from a 20-minute test. Analyzing these longer efforts can help you better understand what is sustainable in a practical sense, particularly within a race setting, regardless of the results you see in a more controlled testing environment. Click below for this workshop.
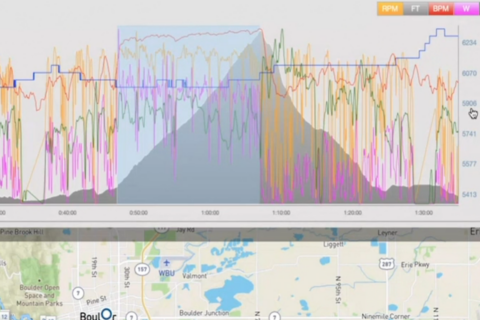
Coach’s Corner: Assessing 60- to 90-min Power to Support 20-min Test Data
How to interpret cadence data
We’ve talked a lot about power analysis. What about other metrics? In this workshop, Coach Ryan and Coach Trevor demonstrate how to interpret and analyze pedaling cadence data in TrainingPeaks. They sleuth the data, looking for signs that the rider’s training schedule, and his daily workload, may have impacted his ability to successfully complete the workout.
Moving past those primary metrics of power and heart rate enable you to find other useful data to support intuition and sensation to improve the training process. Click below for this workshop.
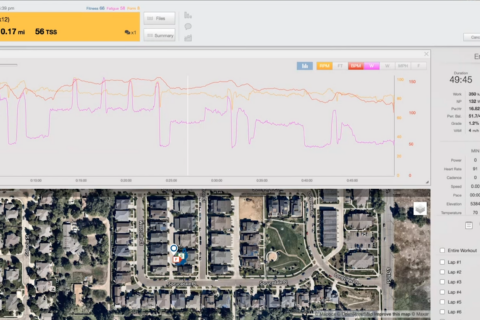
Coach’s Corner: How to Interpret Pedaling Cadence Data
The “hour of power”
Finally, watch this workshop to learn why Dr. Seiler “love-hates” the hour-of-power test for determining improvements in FTP. Good news! A 60-minute Zwift race can be a great substitute for this all-out hourlong test, making it less monotonous, more enjoyable, and giving you solid data. Click below for this workshop.

Zwift Hour of Power: Can a 60-Minute Zwift Race Work as a Test?
The Power of Perception
Going beyond the numbers
We’ve highlighted many workshops and webinars that will help you improve your ability to work with basic data. Now it’s time we turn our attention to the most important computer of them all—your brain.
Julie Young stretched her professional cycling career over a decade, and still races at a high level today across multiple disciplines. She also coaches and works at the Kaiser Sports Medicine Endurance Lab in California.
In this podcast, with Julie’s help, we emphasize the many critical aspects of training and coaching that don’t show up in the numbers. Click below to listen to this podcast.

Beyond the Data—Training Is Not Only About Numbers
The duality of data
Finally, we close with an exploration of the duality of data and intuition. Colby Pearce and Julie Young discuss how to create a helpful and healthy place for data and analysis in your training. Learning to hone your intuition can help you become your best athletic self, especially when it’s paired with the right amount of data.

Coaching with Balance: The Duality of Data and Intuition with Coach Julie Young
Join the conversation
Do you have additional questions or data analysis examples that you would like to share with our endurance community? Head over to the Forum and post there to collaborate.
STILL NEED HELP?
As we said at the start of this Pathway, data analysis is complex and critical. Proper analysis, monitoring, and maintenance is key to progress. If you still need help, schedule a free consultation with us and we will develop a path forward that is individualized for you.
